

Infographics have become a popular way to communicate complex information in a visually appealing way. As we enter the new year of 2023, it’s a good time to take a look at some of the best infographic design trends that have been created in the past year. From data visualizations to educational materials, infographics have been used for a variety of purposes, and the best ones have a few things in common – they are informative, engaging, and visually stunning.
In this blog post, we’ll be showcasing 10 of the best infographic design trends 2023, exploring what makes them stand out and why they are worth checking out.
Let’s begin.
Related: 6 Snackable Content Types Every Marketer Should Know in 2021
What Are Infographics?
Infographics are visual representations of information or data that aim to communicate complex ideas in a simple and engaging way. They combine text, images, and graphics to create a compelling story that can be easily understood by a wide audience. Infographics can be used for a variety of purposes, from presenting data in a scientific report to summarizing the key findings of a marketing campaign.
Infographics make data easier to understand. They are powerful because 90% of information that goes to the brain is visual. This means they can educate someone quickly and effectively. Infographics are 30 times more likely to be read than text, so they are a great way to get your message across.
Here are some key characteristics of infographics:
- They are visual: Infographics use images and graphics to communicate information.
- They are informative: Infographics present information in a clear and concise way, making complex ideas easy to understand.
- They are engaging: Infographics are designed to catch the viewer’s attention and keep them interested.
- They are shareable: Infographics can be easily shared on social media, blogs, and websites, making them a great tool for marketing and outreach.
- They are versatile: Infographics can be used for a wide range of purposes, from educational materials to marketing campaigns.
Why Infographics Are Important?
Many firms incorporate latest infographic design trends in their marketing strategy since they are fun, engaging, and easily shared. Moreover, they can help a marketer to increase website traffic, boost brand awareness, visibility, and engagement. Similarly, educators can use these to explain complicated information by breaking it down into bit-size content. Nonprofits can also use it to raise awareness about a social cause.
In addition to their visual appeal, infographics are highly shareable and can easily go viral on social media, generating buzz and raising awareness for your brand or product. They can also help establish your brand as an expert in your field, as a well-designed and informative infographic can showcase your expertise and authority on a particular topic.
Some Interesting Facts About Infographics:
- Infographics can help boost your website traffic by 12%.
- According to Quick Sprout, content with relevant images gets 94% more views than content without relevant images.
- Almost 32% of the marketers consider visual content as the best type of content.
- There is 80% likelihood of someone reading a colored image or document.
What Makes a Good Infographic?
An infographic is a visual representation of data that supports a thesis. Think of it as a fun and easy-to-scan version of an essay. A good infographic should look nice, stay on brand, provide useful information, and present data logically.
- On-brand
- Visually pleasing
- Provides useful information
- Presents information logically
- Presents facts in easy language
- Shareable
There are thousands of infographic design trends 2023 on the web however it all comes down to how various graphic elements such as icons, colors, images, fonts, and illustrations are integrated to explain a topic in a compelling yet simple way. We have compiled a list of the 10 best infographic design trends of 2023.
Infographic Design Trends 2023
Below, we have shared a list of the best infographics of 2023. Let’s have a look.
1. Bright color palettes
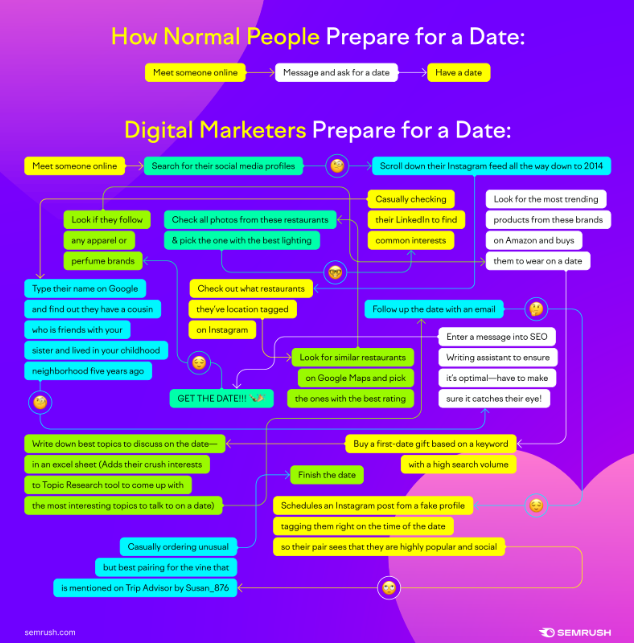
Bright and bold color palettes are among the top infographics design trend in infographic design for 2023. Brands are using highly saturated colors to create visually stimulating designs that captivate audiences and grab their attention. This trend is not only visually appealing, but it also taps into the psychology of color, as bright hues are associated with energy, excitement, and positivity.
SEMrush, among many other popular companies, has been using such infographic design trends to great effect, producing infographics that are visually striking and attention-grabbing. By incorporating bright colors into their designs, these companies are able to convey complex information in a way that is both engaging and easy to understand.
Whether it’s a serious topic or a fun one, using bright and colorful palettes in infographics is a surefire way to capture readers’ attention and make a lasting impression.
2. Snackable Satisfaction
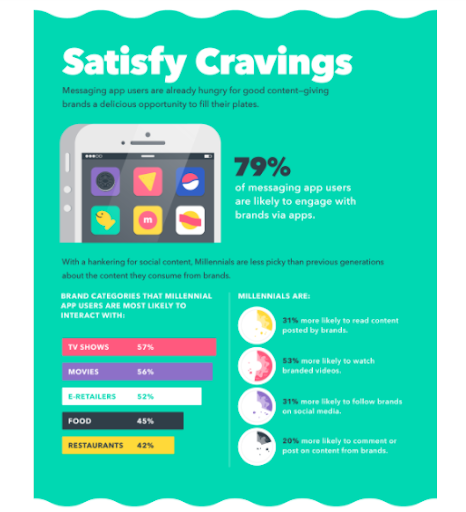
This infographic is about snackable content and it does a great job of informing the readers about the topic. No matter how boring or complex the content is, the writing style is what draws in the readers. Additionally, such infographic design trends depict a clear view of every detail.
Further, this content form uses statistics to indicate its credibility. It states the basics of snackable content, tips for creating good bite-size content, and stats on the advertising industry. Besides, their design is unique, creative but the most important element is the colorful graphics.
3. 30 Shots
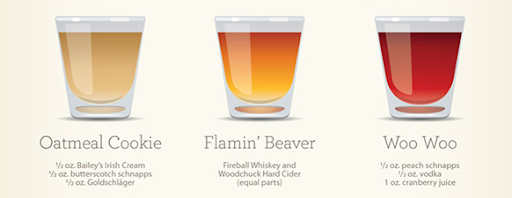
A simple, minimal yet effective infographic about how to make a cocktail. Assorted shots are admired by many people and they are represented well in this infographic. There are 30 recipes of various shots with interesting ingredients. Due to the mute background, the colors of every cocktail stand out to the reader.
Similarly, the use of a gradient creates a realistic representation of the alcoholic concoctions. Further, there’s no need for large text or arrows since the concoction colors do all the work. It is useful since each recipe only needs three to four ingredients thus is easy to recreate.
4. Visualizing the Economics of Coffee

What better way to learn about the stages of coffee production than through an in-depth infographic. Anyone that purchased coffee participated in the $200 billion global coffee chain without even realizing it. However, only a few of us understand the coffee’s journey from beans to cup.
Various stages mentioned in this graphic include growing, exporting, roasting, distribution, and retail. Each stage includes the production cost per cup (475ml), essential statistical data, and striking visuals.
5. Making Billions
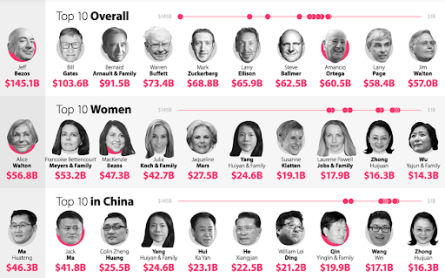
Although there is nothing special about the data presented however this graphic shows similar faces like Bill Gates, Mark Zuckerberg. These infographic design trends were released back in April 2020 however, Jeff Bezos’s spot has been taken by Elon R Musk with a total net worth of $201B.
Moreover, this graphic mentions the world’s richest people across various categories. Some of these categories include top 10 women, top 10 in China, top 10 youngest, top 10 newcomers, top 10 in tech, and top 10 in finance.
6. Font Psychology and Pop Culture
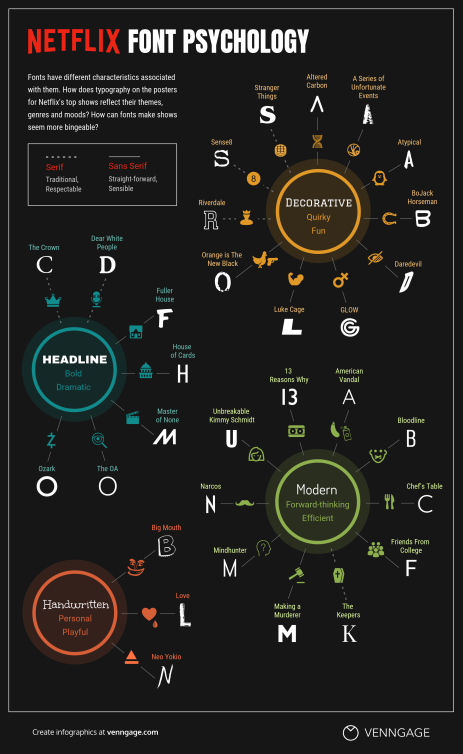
This design was created by Venngage to explore the psychological effects of using various fonts on the target audience. They combined pop culture and psychology to have an everlasting effect on readers. Similarly, they mainly targeted millennials and Gen Z to increase awareness since 70% of Gen Z and 65% of millennials use Netflix.
Further, this infographic referenced some of the most popular Netflix shows. From “Stranger Things” to “13 Reasons Why”, this design states what each typography represents about the viewers’. Additionally, it also depicts what genre, trends, and mood do they point to. For instance, users that watched “Riverdale” are shown as quirky and fun while “Ozark” viewers are indicated as bold and dramatic.
7. Food and Wine Pairing Science
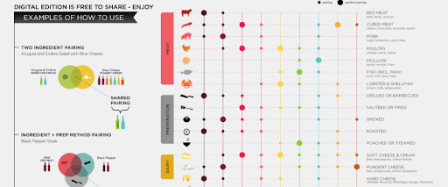
If you’re looking for infographic design trends to pair two subjects, you can use this style. Wine Folly represents the best pairing with this wine and food pairing infographic. Furthermore, this chart is informative and visually appealing. Radiant Venn diagrams are also used to represent shared pairing. Some of the food categories mentioned include meat, dairy, vegetables, starch, herbs, and sweet.
8. Behind The Internet Curtain
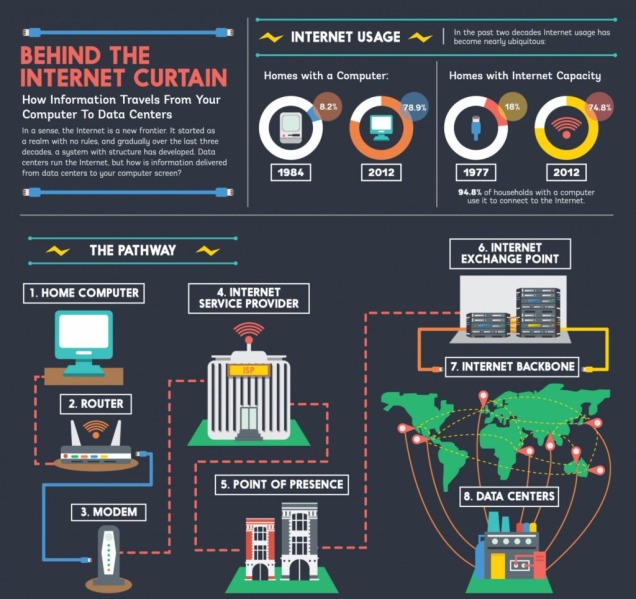
This is also among the best infographic design trends and is the best representation of the power of white text on non-black, dark background. White and black can either be harsh for the eyes or boring but not in this case. Further, this infographic illustrates the internet pathway from home computers to data centers.
9. The ABC of Design
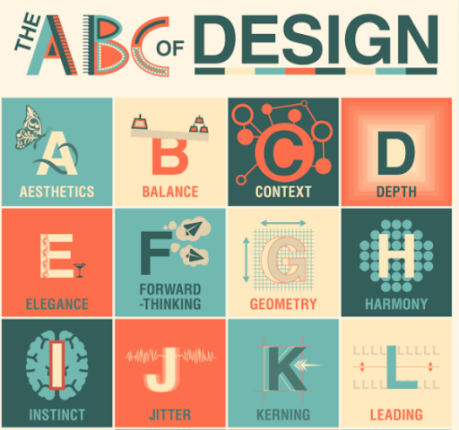
Every graphic designer has different perceptions of design. This infographic states 26 essential words and describes their meaning via stylish graphics. From Aesthetics to symmetry to zing, this design explains how a designer should use certain elements to communicate their thoughts and ideas. In addition, the ABCs of design are elements that every visual design has in common.
10. Visualizing the History of Pandemics
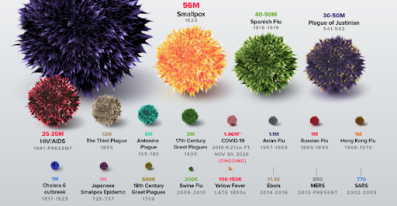
In 2020, COVID-19 swept the world and crashed markets worldwide. Although this virus is unique, however, the history of various pandemics dates back to Roman times.
This infographic compared the death toll of COVID-19 with other pandemics. Some of the pandemics mentioned are Antonine plague, smallpox, cholera 6 outbreak, HIV, Ebola, and many more.
We are still in the COVID-19 pandemic and the final impact is yet uncertain. Nonetheless, 2020 was defined by this deathly pandemic and we hope that things get better with time.
5+ Best Infographics Makers
Here are top 5 platforms that you can use to create amazing infographic design trends in 2023.
1. Canva
Canva is a free and popular tool for creating the latest infographic design trends. It’s powerful and easy to use, allowing anyone to create professional-looking designs in just a few minutes. Canva offers thousands of templates, images, and other content to help you get started.
One of the best features of Canva is that it’s great for global teams. You can organize your content using team folders, collaborate in real-time, and even leave comments on designs. Canva also offers premium design elements for as low as $1.
If you’re part of a large organization, Canva offers subscription plans to simplify your team’s workflow. For individual users and teams looking to grow their business, it’s recommended to get the Canva premium subscription for $9.95 per month. You can even try Canva Pro for free. The best part is that Canva is free to use.
2. Adobe Creative Cloud Express
Adobe Creative Cloud Express (previously Adobe Spark) is a popular tool for creating infographic design trends specifically for social media. It offers a vast range of templates for creating graphics, stories, and thumbnails for social media.
With access to Adobe Stock, users can add millions of trending images to their designs. There are also many design elements, such as icons, backgrounds, and assets, to choose from.
The software uses a drag-and-drop editor, which is simple to use. Just select the template and start editing. Users can also add as many design elements as they want, update backgrounds, add personal logos, and resize the infographic to their liking.
3. Snappa
Snappa is a popular graphic design tool that can help create the best infographic design trends quickly and easily, even if you’re new to it. It offers access to over 5 million high-resolution images and pre-made templates, allowing you to remove backgrounds, add effects, and share your creations directly. Snappa offers a free starter plan that includes three downloads per month.
With Snappa, you can easily remove backgrounds and add various effects and images. You can also directly share your infographics. Their free starter plan allows for up to 3 downloads per month.
4. Piktochart
Piktochart is a tool that helps you make infographic design trends easily, even if you’re a beginner. You can use templates to improve how your business communicates visually, both inside and outside.
With Piktochart, you can change the look of your infographic design trends by adding your own fonts and colors. The editor is easy to use. There’s also a free library of pictures and templates, so you don’t have to spend hours looking for good images that you can use legally.
You can choose from different plans depending on what you need. There’s a free plan, a pro plan, and an enterprise plan. The pro plan costs $14 per month for each user. It’s great for small teams who want to tell their story visually and work together easily.
5. DesignCap
DesignCap is a tool for designing online that lots of people like because it makes you look like a professional. It’s a free way to make infographics, and it’s really easy to use, especially if you’re new to design and don’t want to spend any money. It offers latest templates to create amazing infographic design trends.
You can make your infographics look great by choosing from lots of different things like pictures, icons, and illustrations. DesignCap offers different plans depending on what you want. There’s a free plan, a basic plan, and a plus plan.
The free plan has fewer templates and pictures to choose from, and you can only download five designs.
Final Thoughts:
Conclusively, infographics are an amazing advertising strategy for lead generation, capturing a prospect’s interest, and increasing customer engagement.
If you are unable to create engaging, fun, and interesting infographic design trends, and need help incorporating them into your marketing strategy, schedule a FREE Consultation with AdRush today.
We are a full-service digital marketing agency excelling in Social Media Marketing, Email Marketing, Content Marketing, Search Engine Marketing, and Search Engine Optimization (SEO).